Introduction
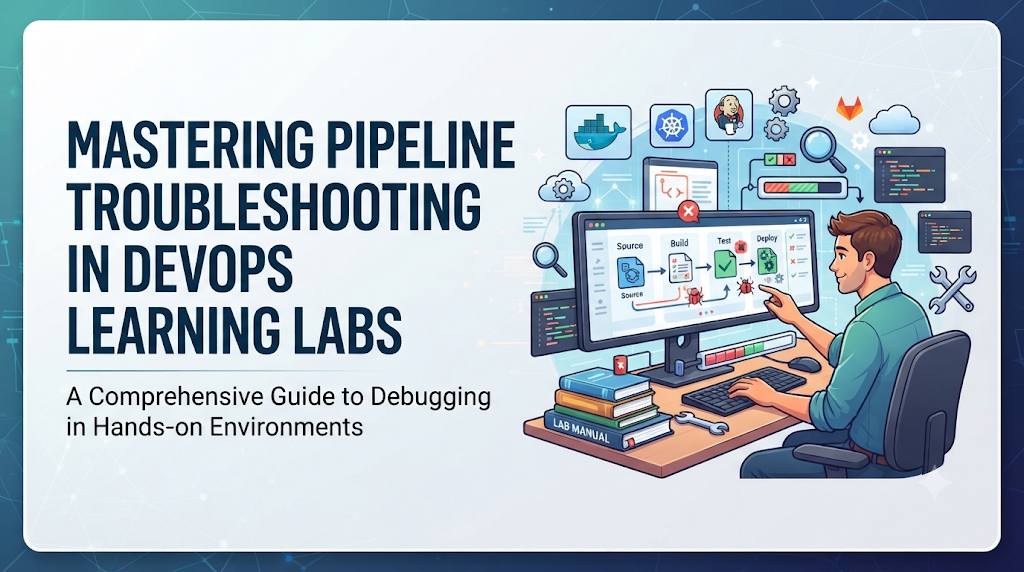
Imagine pushing a minor code change, switching to your continuous integration dashboard, and expecting green checkmarks—only to be greeted by a sudden pipeline failure. For many learners, the immediate reaction is frustration, often leading to wasted time through random configuration tweaks or repeated re-runs. In real-world engineering, however, debugging is a vital competency rather than a mere obstacle. Controlled learning labs provide the ideal sandbox to build this intuition, with organizations like DevOpsSchool offering structured environments where students and professionals can safely experience real-world failures and master practical troubleshooting. This article explores a systematic framework for identifying, investigating, and resolving CI/CD pipeline errors.
Section A: Understand What Happens Inside a CI/CD Pipeline
Before you can fix a broken pipeline, you must understand how a pipeline executes. A Continuous Integration and Continuous Deployment pipeline is an automated sequence of stages designed to take code from a developer’s workstation and safely deliver it to a target environment.
A standard pipeline lifecycle typically follows these sequential stages:
- Source Code Checkout: The runner or build agent connects to the version control system, authenticates, and clones or pulls the specific commit or branch.
- Dependency Installation: The environment downloads and installs required libraries, packages, and modules specified by manifest files like package.json, requirements.txt, or pom.xml.
- Build and Compilation: Source code is compiled into executable binaries, bytecode, or packaged bundles.
- Automated Testing: Unit tests, integration tests, and linting checks are executed to validate functional correctness and code style.
- Code Quality and Security Checks: Static code analysis tools scan the codebase for vulnerabilities, code smells, and license compliance issues.
- Artifact Creation: Successful builds are packaged into distributable artifacts, such as Docker container images, JAR files, or zip archives, and pushed to a registry.
- Deployment: Artifacts are deployed to staging, testing, or production environments using configuration management tools or deployment scripts.
- Post-deployment Validation: Health checks, smoke tests, and synthetic transactions verify that the deployed application is responsive and healthy.
When a pipeline fails, it almost always stops execution at a specific stage. Because pipelines are sequential or directed acyclic graphs, a failure in an early stage—such as a missing dependency or a syntax error during compilation—prevents all subsequent stages from running. Conversely, an artifact creation failure means your code passed tests successfully but could not be packaged or published. Learning to pinpoint the exact stage where execution halted is the first step toward efficient debugging.
Section B: Prepare a Lab That Makes Debugging Easier
Effective debugging requires a predictable, isolated, and repeatable environment. If your learning lab is messy, configuration settings are scattered, or credentials are hardcoded insecurely, troubleshooting becomes nearly impossible.
To create a robust debugging lab, ensure you have the following components:
- A Sample Application and Source Repository: Use a small, understandable application with a known working baseline commit.
- A CI/CD Platform: Set up an accessible local or cloud-hosted instance of Jenkins, GitHub Actions, or GitLab CI/CD.
- A Suitable Runtime and Build Environment: Ensure your build agents or runners have the correct language runtimes, compilers, and CLI tools installed.
- Test Credentials and Environment Variables: Store configuration secrets using secure environment variables or secret managers rather than hardcoding them into scripts.
- Access to Pipeline Logs: Ensure you have permissions to view full console logs, historical runs, and artifact outputs.
- Version Control and Rollback: Keep your lab pipeline configurations under version control so you can easily revert experimental changes.
- Isolated Infrastructure: Use local containers, virtual machines, or sandboxed cloud accounts so that debugging mistakes do not impact production systems or share sensitive data.
Preparing a clean lab environment ensures that when a pipeline fails, you know the failure was caused by the specific change you introduced rather than environmental drift or missing dependencies on the host machine.
Section C: Follow the Evidence Before Changing Anything
When faced with a failing pipeline, experienced engineers follow a disciplined investigation method rather than making random edits. Adopt this structured approach every time you encounter an error in your lab:
- Confirm That the Pipeline Actually Failed: Verify the run status in the dashboard and ensure it was not a transient network glitch or timeout.
- Identify the First Failing Stage: Locate the specific step or stage where the execution stopped with a non-zero exit code.
- Record the Complete Error Message: Copy the exact error traceback or failure message rather than skimming it.
- Review the Surrounding Log Entries: Read 20 to 30 lines above and below the error message to understand the context leading up to the failure.
- Compare the Failed Run with a Previous Successful Run: Check what changed between the last green build and the current red build.
- Check Recent Code and Configuration Changes: Inspect commits, pull requests, or YAML file edits made right before the failure.
- Reproduce the Problem When Possible: Try running the failing command locally in your terminal or inside an interactive container shell.
- Test One Potential Cause at a Time: Change a single variable, dependency version, or configuration line, then re-run the pipeline to observe the outcome.
Changing several settings simultaneously destroys your ability to learn. If the pipeline suddenly works after altering five different lines, you still do not know which specific change fixed the issue, leaving you vulnerable to repeating the same mistake.
Section D: Common Pipeline Failures Learners Should Practice
Learning labs should expose students to a diverse variety of failure types. The following categories cover the most common issues encountered in CI/CD pipelines.
1. Source Code and Repository Problems
- Incorrect Repository URL or Branch: Pointing the pipeline to a non-existent branch or misspelled repository URL.
- Authentication Failures: Expired SSH keys, invalid tokens, or missing deploy keys causing checkout rejections.
- Missing Files or Merge Conflicts: Unresolved conflict markers in code files or missing configuration files required by the build script.
- Investigation Steps: Check the VCS trigger logs, verify credentials in project settings, and inspect git remote configuration.
- Corrective Action: Correct repository URLs, renew authentication tokens, resolve merge conflicts locally, and push clean commits.
2. Dependency and Build Failures
- Missing Packages: Packages omitted from dependency manifest files or unavailable in the configured package registry.
- Incorrect Dependency Versions: Incompatible version constraints causing resolution conflicts during installation.
- Compilation Failures: Syntax errors, missing semicolons, or type mismatches caught by the compiler.
- Investigation Steps: Review dependency installation logs for 404 errors, network timeouts, or missing package errors. Inspect compiler output for file names and line numbers.
- Corrective Action: Update manifest files with correct package names and compatible version ranges, fix local syntax errors, and ensure mirror or proxy settings are correct.
3. Test Execution Problems
- Failed Unit or Integration Tests: Assertions failing due to altered business logic or broken assumptions.
- Missing Test Data: Tests failing because database fixtures, mock files, or environment inputs are absent.
- Flaky Tests: Tests that pass or fail inconsistently due to race conditions, network dependencies, or hardcoded time values.
- Investigation Steps: Run the specific failing test locally with verbose logging enabled. Check test reports and stack traces to identify the exact assertion that failed.
- Corrective Action: Fix the underlying application bug or update test assertions to match new requirements. Isolate tests from external network dependencies using mocks.
4. Environment and Configuration Issues
- Missing Environment Variables: Required variables like database connection strings or API keys returning null or undefined values.
- Permission Problems: Build scripts attempting to write to read-only directories or lacking execution permissions on shell scripts.
- Incompatible Runtime Settings: Mismatched software versions between local development environments and CI runners.
- Investigation Steps: Print environment variables safely in a debug step or inspect configuration injection mechanisms. Check file permissions using
ls -l. - Corrective Action: Define missing variables in CI/CD secret stores, add appropriate permissions using
chmod +x, and align runtime versions using containerized build environments.
5. Deployment Failures
- Incorrect Deployment Target: Deploying to an incorrect server IP, cluster namespace, or cloud bucket.
- Container Image Not Found: Pulling an image tag that was not successfully built or pushed during earlier stages.
- Health-Check Failures: Deployment succeeding, but the application failing startup health checks, triggering an automatic rollback.
- Investigation Steps: Inspect deployment script logs, verify registry image tags, and check target environment application logs.
- Corrective Action: Fix deployment target configurations, ensure proper image tagging and pushing order, and resolve application startup errors.
Section E: Hands-On Debugging Exercises for Learning Labs
To bridge theory and practice, learners should work through structured exercises. Here are five practical lab exercises with increasing difficulty.
Exercise 1: Fix a Repository Checkout Failure
- Learning Objective: Learn to diagnose and resolve authentication and repository reference errors during the checkout stage.
- Lab Prerequisites: A local Git repository and a CI/CD pipeline configured with an intentional typo in the repository URL or branch name.
- Initial Problem: The pipeline fails instantly at the checkout stage.
- Expected Error or Symptom:
fatal: repository '...' not foundorBranch 'main-dev' does not exist. - Investigation Steps: Open the pipeline console output, locate the checkout step, and examine the exact URL and branch parameters passed to the Git plugin.
- Corrective Action: Edit the pipeline configuration file, correct the branch name or repository URL, save the file, and trigger a new build.
- Expected Result: The checkout stage clones the repository successfully and proceeds to dependency installation.
- Questions to Answer: Why did the pipeline fail before executing any build scripts? How can you verify branch existence locally before pushing?
Exercise 2: Resolve a Dependency Installation Error
- Learning Objective: Understand how to read package manager error logs and fix missing or incompatible dependency definitions.
- Lab Prerequisites: A sample project where a required package has been removed from
package.jsonorrequirements.txt. - Initial Problem: The build stage fails during package installation.
- Expected Error or Symptom:
ModuleNotFoundError: No module named 'requests'ornpm ERR! code E404. - Investigation Steps: Inspect the package manager output logs. Look for the specific package name that failed to install or resolve.
- Corrective Action: Add the missing dependency to the manifest file with an appropriate version constraint, commit the change, and re-run the pipeline.
- Expected Result: Packages install completely without errors, allowing the pipeline to advance to testing.
- Questions to Answer: What is the difference between a build-time dependency and a runtime dependency? Why is locking dependency versions important in CI/CD?
Exercise 3: Investigate a Failed Automated Test
- Learning Objective: Differentiate between application bugs and test configuration errors by analyzing test execution reports.
- Lab Prerequisites: A project containing a unit test where an expected mathematical calculation or string output has been intentionally altered.
- Initial Problem: The test stage fails, causing the pipeline to abort before artifact creation.
- Expected Error or Symptom:
AssertionError: Expected 10 but got 15or test runner summary showing 1 failure out of 25 tests. - Investigation Steps: Open the test result artifact or console output. Locate the stack trace pointing to the failing test file and line number. Determine if the application logic or the test assertion is incorrect.
- Corrective Action: Fix the erroneous code or update the test expectation if requirements changed. Commit and re-run.
- Expected Result: All tests pass successfully, clearing the path for artifact packaging.
- Questions to Answer: Should you ever disable a failing test to make the pipeline pass? How do unit tests differ from integration tests in pipeline failures?
Exercise 4: Debug a Container Build Problem
- Learning Objective: Practice inspecting Dockerfile instructions and build context issues during container image creation.
- Lab Prerequisites: A project with a Dockerfile containing an invalid file copy path or a missing build argument.
- Initial Problem: The container build stage fails midway through execution.
- Expected Error or Symptom:
COPY failed: file not found in build context or excluded by .dockerignore. - Investigation Steps: Examine the Docker build logs to identify the exact step number and instruction that failed. Check the local file structure against the paths specified in the Dockerfile.
- Corrective Action: Correct the source path in the Dockerfile or adjust the
.dockerignorefile, then rebuild the pipeline. - Expected Result: The Docker image builds successfully and is pushed to the local container registry.
- Questions to Answer: What is the build context in Docker, and why does file placement matter? How can you test a Dockerfile locally before committing?
Exercise 5: Troubleshoot a Deployment Failure
- Learning Objective: Investigate deployment script errors and application health-check failures in a staging environment.
- Lab Prerequisites: A pipeline configured to deploy an application to a test server using a script with an invalid environment variable or incorrect port binding.
- Initial Problem: The deployment stage fails or the application crashes immediately after startup.
- Expected Error or Symptom:
Connection refusedor health-check endpoint returning HTTP 503 Service Unavailable. - Investigation Steps: Review deployment logs, check target server or container logs, and verify that environment variables required by the runtime are correctly injected.
- Corrective Action: Fix the port configuration in the deployment manifest or provide the missing environment variable, then re-deploy.
- Expected Result: The application starts successfully, passes health checks, and the pipeline completes.
- Questions to Answer: Why are post-deployment health checks critical in CI/CD? How do you ensure rollback mechanisms work when deployments fail?
Section F: Debugging With Different CI/CD Platforms
While troubleshooting methodology remains consistent across tools, each CI/CD platform provides unique interfaces and diagnostic features.
Jenkins
- Diagnostic Features: Console output, stage-level logs, pipeline syntax validator, agent status pages, and workspace file browsers.
- Debugging Techniques: Use the Pipeline Syntax snippet generator to test syntax. Wrap risky blocks in
try-catchstatements or useechostatements to inspect variable values. Check agent node availability and workspace cleanliness if builds fail due to locked files.
GitHub Actions
- Diagnostic Features: Workflow run summaries, job-specific step logs, environment variable inspection, and runner diagnostics.
- Debugging Techniques: Enable runner diagnostic logging by setting repository secrets
ACTIONS_STEP_DEBUGtotrue. Use theactions/upload-artifactstep to capture configuration files or logs when a job fails. Test workflows locally using tools likeact.
GitLab CI/CD
- Diagnostic Features: Job traces, pipeline graphs, stage inspection, runner status, and downloadable job artifacts.
- Debugging Techniques: Enable debug logging (trace mode) by defining the CI/CD variable
CI_DEBUG_TRACEastrue. Usegitlab-runner execfor local pipeline simulation and validate.gitlab-ci.ymlsyntax directly in the GitLab web interface.
Understanding these platform-specific tools ensures learners can transfer their troubleshooting skills seamlessly across different enterprise tech stacks.
Section G: Useful Commands and Diagnostic Techniques
Equipping yourself with the right commands accelerates the diagnostic process in your lab environment. Here are essential commands and what they help diagnose:
git statusandgit log -n 5: Inspects current working tree changes and recent commit history to see what was modified.node -v,python3 --version, ormvn -version: Verifies that the correct language runtime and compiler versions are installed in the environment.printenvorenv: Lists current environment variables safely to verify configuration injection. Note: Never print sensitive tokens or passwords in shared logs.docker imagesanddocker ps -a: Inspects local container images and container execution status during build troubleshooting.tail -n 50 /var/log/app.logorjournalctl -u service-name: Reads recent application or system service logs to diagnose runtime failures.curl -I http://localhost:8080/health: Tests network connectivity and HTTP response codes for local or deployed services.yamllint pipeline.yaml: Validates YAML syntax and formatting errors before committing configuration files.ls -la: Inspects file permissions, hidden configuration files, and directory structure in the workspace.
Reviewing the output of these commands helps you narrow down whether an issue stems from code syntax, environment configuration, or network connectivity.
Section H: Debugging Habits That Build Real Engineering Skills
Technical knowledge alone is not enough; sustainable debugging relies on disciplined professional habits. Cultivate the following practices in your learning labs:
- Read complete error messages before searching for fixes online.
- Identify the earliest failure rather than focusing only on the final crash traceback.
- Change one variable at a time during experimentation.
- Keep all lab configurations under version control so you can track changes.
- Record the root cause and resolution in your personal engineering notes.
- Re-run relevant tests after applying a fix to ensure no regressions were introduced.
- Avoid copying and pasting terminal commands without understanding what they do.
- Reproduce production-like failures in controlled sandbox environments.
- Ask for help by providing complete logs, error messages, and reproduction steps rather than vague descriptions.
Developing these habits transforms you from a reactive student into a proactive, analytical engineer capable of diagnosing unfamiliar systems with confidence.
Section I: When a Pipeline Fix Creates Another Problem
A common trap for learners is celebrating too early when a pipeline finally turns green. A passing pipeline does not always mean the underlying problem has been solved correctly. Dangerous shortcuts can introduce severe risks:
- Fixes that hide symptoms: Suppressing an error message or wrapping unstable code in a blanket try-catch block without addressing the root cause.
- Skipping tests: Disabling failing unit tests simply to make the pipeline pass.
- Weakening security checks: Lowering static analysis thresholds or bypassing vulnerability scanners.
- Using excessive permissions: Granting root or administrator privileges to build runners to bypass permission errors.
- Hardcoding credentials: Embedding passwords or API keys directly into configuration files.
- Ignoring flaky tests: Pretending intermittent test failures do not matter.
- Changing dependencies blindly: Upgrading package versions without checking compatibility, breaking downstream modules.
For example, suppose a unit test fails because a database connection times out during test execution. A hurried engineer might comment out the test or increase the timeout limit to an absurd duration without investigating why the database response was slow. While the pipeline turns green, the underlying database latency or query inefficiency remains unaddressed, leading to catastrophic performance degradation in production. Always verify that your fix addresses the root cause rather than bypassing the guardrail.
Section J: Measuring Progress in Pipeline Debugging
How do learners and trainers know when debugging skills are improving? True progress is measured through qualitative and quantitative markers:
- Time to Root Cause: Decreasing time spent moving from initial error detection to identifying the actual root cause.
- Fewer Trial-and-Error Attempts: Reducing the number of random, speculative commits pushed to fix a pipeline.
- Successful Lab Completion: Consistently solving structured failure scenarios without external assistance.
- Root-Cause Accuracy: Providing clear, technically accurate explanations of why a failure occurred and why the fix worked.
- Quality of Documentation: Maintaining detailed, structured troubleshooting notes.
- Verification Discipline: Thoroughly testing fixes and running regression checks before marking an issue resolved.
- Log Comprehension: Reading raw console outputs and stack traces fluently without getting overwhelmed.
Speed is secondary to accuracy. An engineer who takes ten minutes to diagnose a problem correctly through evidence is far more valuable than one who pushes five guessing commits in two minutes.
Section K: A Learning Roadmap for Independent Pipeline Troubleshooting
To master pipeline debugging, follow a structured, progressive learning roadmap:
- Beginner Level: Focus on understanding pipeline stages, reading basic console logs, identifying syntax errors, and correcting repository checkout or YAML formatting issues.
- Intermediate Level: Practice debugging dependency installation failures, running and fixing unit tests, building container images with Docker, and managing environment variables.
- Advanced Level: Investigate complex runner failures, permission boundaries, multi-stage deployment workflows, network connectivity issues, and rollback mechanisms.
- Independent Readiness: Tackle unfamiliar, multi-faceted failure scenarios without step-by-step guides, document root causes clearly, and explain fixes to peers.
Transitioning from guided lab exercises to independent troubleshooting builds the resilience needed for modern DevOps and site reliability engineering roles.
Frequently Asked Questions
1. What is pipeline debugging in DevOps?
Pipeline debugging is the systematic process of identifying, investigating, and resolving errors that occur during the automated execution of CI/CD pipeline stages.
2. Why do CI/CD pipelines fail in learning labs?
Pipelines fail due to common errors such as incorrect repository references, missing dependencies, failing unit tests, misconfigured environment variables, or deployment script bugs.
3. How should beginners read pipeline error logs?
Beginners should locate the exact stage where execution stopped, scroll up to find the initial error message or traceback, and read the surrounding log lines for context rather than focusing only on the final failure summary.
4. What is the first step when a Jenkins pipeline fails?
The first step is to open the Jenkins console output for the failed run, locate the failing stage, and examine the step-by-step logs to identify the exact command that returned a non-zero exit code.
5. How can learners debug GitHub Actions workflows?
Learners can inspect job execution steps in the GitHub Actions tab, enable runner diagnostic logging via repository secrets, and review artifact outputs or step failure summaries.
6. What causes dependency installation failures?
Dependency failures are typically caused by missing manifest entries, incorrect version constraints, network timeouts, or packages being unavailable in the target repository registry.
7. Can Docker problems cause CI/CD pipeline failures?
Yes. Issues such as invalid Dockerfile instructions, incorrect file copy paths, missing build context files, or base image pull errors frequently break container build stages.
8. How can learners practice debugging without affecting production?
Learners should use isolated local environments, sandboxed cloud accounts, or dedicated learning labs where mistakes cannot impact live production systems or expose real credentials.
9. What is the difference between fixing an error and finding its root cause?
Fixing an error stops the symptom from occurring immediately, whereas finding the root cause identifies the underlying design flaw or configuration mistake that caused the error in the first place.
10. How can trainers assess pipeline troubleshooting skills?
Trainers can evaluate students based on their ability to interpret logs accurately, their adherence to structured investigation steps, the quality of their root-cause explanations, and their avoidance of trial-and-error guessing.
Conclusion
Pipeline failures are an inevitable and valuable part of working with DevOps automation. In learning labs, every red build, failed test, and broken dependency serves as a practical lesson in how complex software systems interact. By replacing frustration and guesswork with evidence-based investigation, structured log analysis, and safe experimentation, learners develop resilient troubleshooting habits. Mastering these skills transforms pipelines from unpredictable barriers into reliable feedback loops. Whether you are a student taking your first steps into automation or a professional refining your operational expertise, embracing systematic debugging is the key to building robust, secure, and efficient delivery workflows.