
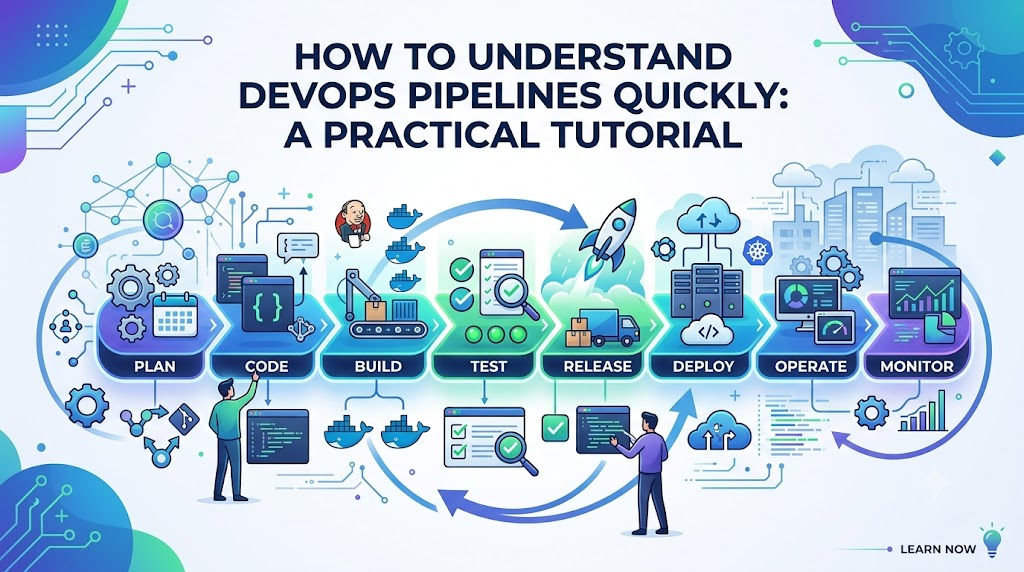
If you are new to DevOps, pipelines can look much more complicated than they really are.
You may open a Jenkinsfile, GitHub Actions workflow, GitLab CI file, or Azure DevOps pipeline and see stages, jobs, runners, variables, conditions, artifacts, credentials, Docker commands, deployment scripts, and YAML configuration all mixed together.
It is easy to think:
“I need to understand all of this before I can understand the pipeline.”
You don’t.
The fastest way to understand a DevOps pipeline is to stop looking at it as a large configuration file and start looking at it as a software delivery flow.
At its simplest:
Developer changes code
        ↓
Code is built
        ↓
Tests are executed
        ↓
Security and quality checks
        ↓
Artifact is created
        ↓
Artifact is deployed
        ↓
Deployment is verified
        ↓
Release is promoted or rolled back
Once you understand this flow, the individual pipeline commands become much easier to follow.
This tutorial will show you exactly how to read a DevOps pipeline, what to look for first, how the major components fit together, and how to troubleshoot a pipeline when something goes wrong.
What Is a DevOps Pipeline?
A DevOps pipeline is an automated sequence of activities used to build, test, package, and deliver software.
A simple pipeline might look like this:
Git Push
   ↓
Checkout Code
   ↓
Build
   ↓
Unit Test
   ↓
Security Scan
   ↓
Create Artifact
   ↓
Deploy to Staging
   ↓
Smoke Test
   ↓
Deploy to Production
The pipeline automates work that would otherwise have to be performed manually.
For example, without automation, someone might need to:
- Pull the latest code.
- Install dependencies.
- Build the application.
- Run tests.
- Create a package.
- Copy it to a server.
- Restart the application.
- Check whether the application is working.
A pipeline turns that process into a repeatable workflow.
The important word here is repeatable.
A good pipeline should produce a predictable result when the same conditions and inputs are provided.
The Fastest Way to Understand Any DevOps Pipeline
When you open an unfamiliar pipeline, don’t immediately read it from the first line to the last line.
Instead, answer these questions in order:
- What starts the pipeline?
- Where does the code come from?
- Where does the pipeline run?
- What are the major stages?
- What does each stage produce?
- What artifact is being delivered?
- Where is it deployed?
- What conditions control execution?
- How are secrets and credentials handled?
- How do we know the deployment succeeded?
- What happens if something fails?
These questions give you the pipeline’s structure before you get lost in implementation details.
Step 1: Find What Triggers the Pipeline
Start by asking:
When does this pipeline run?
Common triggers include:
- Code push
- Pull request
- Merge to a branch
- Git tag
- Release creation
- Scheduled execution
- Manual execution
- Completion of another pipeline
For example, conceptually:
on:
  push:
    branches:
      - main
This means the pipeline is triggered when code is pushed to the main branch.
Another pipeline might run when a pull request is opened:
on:
  pull_request:
    branches:
      - main
The exact syntax differs between CI/CD platforms, but the idea is the same.
Why the trigger matters
The trigger tells you why the pipeline is running.
A pull-request pipeline might perform:
Build
 ↓
Unit Tests
 ↓
Lint
 ↓
Security Checks
A production pipeline might instead perform:
Get Approved Artifact
 ↓
Deploy
 ↓
Health Check
 ↓
Monitor
So the first thing you should write down when analyzing a pipeline is:
Trigger = ?If you cannot answer that, you don’t yet understand when the pipeline is supposed to operate.
Step 2: Identify the Source Code
Next, find out:
Which source code is the pipeline processing?
Usually the source comes from a Git repository.
You need to identify:
- Repository
- Branch
- Commit
- Tag
- Pull request, if applicable
Think about the relationship like this:
Git Repository
      ↓
Specific Commit
      ↓
Pipeline Run
This is important when troubleshooting.
Suppose a developer says:
“The pipeline passed yesterday but is failing today.”
Don’t immediately compare the pipeline configuration.
First check whether the source code changed.
A useful question is:
What exact commit produced this pipeline run?
That commit should be traceable to the resulting artifact and deployment.
Step 3: Find the Runner or Agent
Now ask:
Where does the pipeline actually execute?
A CI/CD pipeline needs some execution environment.
Depending on the platform, it may be called:
- Runner
- Agent
- Build agent
- Worker
- Executor
The runner is where commands such as these actually execute:
npm install
npm test
mvn package
docker build
kubectl apply
The basic relationship is:
Pipeline Definition
        ↓
Runner / Agent
        ↓
Commands Execute
This becomes important when a pipeline works on one runner but fails on another.
For example, the required:
- Java version
- Node.js version
- Docker tooling
- Kubernetes CLI
- cloud CLI
- environment variables
may not exist on every runner.
So when a pipeline fails unexpectedly, check the execution environment.
Step 4: Ignore the Detailed Commands and Find the Major Stages
This is one of the most useful shortcuts.
Suppose you open a pipeline with 300 lines of configuration.
Don’t read all 300 lines.
First reduce it to something like:
Build
 ↓
Test
 ↓
Scan
 ↓
Package
 ↓
Deploy
 ↓
Verify
Now you have the architecture.
Only after understanding the architecture should you examine the individual commands.
A useful mapping is:
| Pipeline Stage | Question to Ask |
|---|---|
| Checkout | What code are we using? |
| Build | Can we create the application? |
| Test | Does the application behave correctly? |
| Scan | Does it satisfy security/quality requirements? |
| Package | What deployable artifact is created? |
| Publish | Where is the artifact stored? |
| Deploy | Where is the artifact released? |
| Verify | Did the application actually become healthy? |
| Rollback | How do we recover from a bad release? |
This table is essentially your pipeline-reading cheat sheet.
Step 5: Understand the Build Stage
The build stage transforms source code into something usable.
For example, a Java application might be built using Maven:
mvn clean packageA Node.js application might use:
npm install
npm run build
A containerized application might use:
docker build -t myapp:1.0 .The technology changes, but the basic idea remains:
Source Code
     ↓
Build Process
     ↓
Build Output
When reading the build stage, ask:
- What language is being used?
- What build tool is being used?
- Which dependencies are required?
- Where does the output go?
- Does the build fail if compilation fails?
- Is the output stored for later stages?
You don’t need to memorize the command.
Understand what the command is accomplishing.
Step 6: Understand Testing
After the build, look for testing.
Typical tests include:
- Unit tests
- Integration tests
- API tests
- End-to-end tests
- Smoke tests
- Performance tests
A simple CI flow could be:
Code
 ↓
Build
 ↓
Unit Tests
 ↓
Artifact
The important part is not simply that tests exist.
You should determine:
What happens when the test fails?
A healthy pipeline might behave like this:
Build
  ↓
Tests
  ↓
FAIL
  ↓
Pipeline Stops
The failed build should not quietly continue toward production.
Testing therefore acts as a quality gate.
Step 7: Understand Quality and Security Checks
Modern pipelines often include checks beyond functional testing.
Examples include:
- Static code analysis
- Dependency scanning
- Container image scanning
- Secret detection
- Infrastructure-as-Code scanning
- License checks
- Policy checks
A pipeline might look like:
Build
 ↓
Unit Tests
 ↓
Code Quality
 ↓
Dependency Scan
 ↓
Container Scan
 ↓
Package
When analyzing these stages, ask:
What problem is this check trying to prevent?
For example:
- Unit tests catch functional defects.
- Static analysis can identify code-quality problems.
- Dependency scanning can identify vulnerable dependencies.
- Container scanning can identify issues in an image.
- Secret scanning can help prevent credentials from reaching repositories.
The important thing is to understand the control, not just the tool name.
Step 8: Learn What an Artifact Is
This is one of the concepts that makes DevOps pipelines much easier to understand.
An artifact is a versioned output produced by the build process.
Examples include:
- JAR
- WAR
- ZIP
- Binary
- npm package
- Python package
- Container image
For example:
Source Code
     ↓
Maven Build
     ↓
application.jar
Here, application.jar is the artifact.
For containers:
Source Code
     ↓
Docker Build
     ↓
myapp:1.4.2
Here, the container image is the artifact.
The pipeline should make it clear what artifact is being produced and which version is being delivered.
Build Once, Promote the Same Artifact
This is an important practice in reliable CI/CD.
Consider this:
Build Application
       ↓
Development
       ↓
Build Again
       ↓
Testing
       ↓
Build Again
       ↓
Production
You now have multiple builds.
That creates unnecessary uncertainty.
A cleaner model is:
Source Code
     ↓
Build Once
     ↓
Artifact v1.4.2
     ↓
Development
     ↓
Testing
     ↓
Staging
     ↓
Production
The same artifact is promoted through the environments.
This makes it easier to answer:
What exactly was tested and what exactly was deployed?
That traceability is extremely valuable during incidents.
Step 9: Understand the Artifact Repository
Once an artifact is created, ask:
Where is it stored?
Common artifact destinations include:
- Container registries
- Package repositories
- Binary repositories
- Cloud artifact services
The flow might look like:
Build
 ↓
Create Artifact
 ↓
Artifact Repository
 ↓
Deployment
For a container:
Docker Build
     ↓
myapp:1.4.2
     ↓
Container Registry
     ↓
Kubernetes
When troubleshooting, verify that the deployment is using the expected artifact version.
A surprisingly common source of confusion is deploying the wrong tag or assuming that latest means what you think it means.
Explicit versioning is generally easier to reason about.
Step 10: Understand Environments
Most delivery systems have multiple environments.
For example:
Development
     ↓
QA
     ↓
Staging
     ↓
Production
Not every organization needs all four.
What matters is understanding how the application moves between environments.
Ask:
- Which environments exist?
- Which pipeline deploys to each one?
- What conditions are required?
- Is approval required?
- Is the same artifact promoted?
A typical flow might be:
Artifact v2.3
    ↓
Deploy to Dev
    ↓
Automated Tests
    ↓
Deploy to Staging
    ↓
Smoke Tests
    ↓
Approval
    ↓
Production
Now the pipeline has a clear delivery story.
Step 11: Understand Deployment
Next ask:
How does the pipeline actually deploy the application?
Common targets include:
- Virtual machines
- Docker hosts
- Kubernetes
- Cloud application services
- Serverless platforms
For Kubernetes, a pipeline might use commands such as:
kubectl apply -f deployment.yamlor:
helm upgrade --install myapp ./chartBut don’t stop at the command.
Ask what it changes.
For example:
Container Image
      ↓
Kubernetes Deployment
      ↓
Pods
      ↓
Service
      ↓
Users
That is the deployment chain you need to understand.
Step 12: Understand Variables
Pipelines usually contain variables.
Examples:
APP_NAME
VERSION
ENVIRONMENT
IMAGE_TAG
REGISTRY
NAMESPACE
Don’t try to understand every variable immediately.
Group them by purpose.
Application variables
APP_NAME
VERSION
Deployment variables
ENVIRONMENT
NAMESPACE
Artifact variables
IMAGE_TAG
REGISTRY
Then ask:
What decision does this variable influence?
For example:
ENVIRONMENT=production
        ↓
Production deployment configuration
This is easier to understand than simply memorizing variable names.
Step 13: Understand Secrets and Credentials
Pipelines often need access to external systems.
For example:
Pipeline
   ├── Git
   ├── Container Registry
   ├── Cloud
   └── Kubernetes
These systems may require:
- Tokens
- Passwords
- API keys
- Certificates
- SSH credentials
- Cloud credentials
Never assume that a secret should be written directly into the pipeline file.
Bad practice:
password: MyPassword123A better design is to reference credentials stored through the CI/CD platform’s secret-management capabilities or an external secrets-management system.
When reviewing a pipeline, ask:
- Where do credentials come from?
- Who can access them?
- Are they exposed in logs?
- Does the pipeline use least privilege?
- Can a pull-request job access production credentials?
That last question is especially important.
A pipeline should not give every job unrestricted production access simply because it is convenient.
Step 14: Find Conditions and Branch Logic
A pipeline may contain stages that execute only under certain conditions.
For example:
Pull Request
     ↓
Build
     ↓
Test
     ↓
Scan
But:
Main Branch
     ↓
Build
     ↓
Test
     ↓
Scan
     ↓
Deploy
And perhaps:
Release Tag
     ↓
Production Deployment
When reading conditions, ask:
What causes this stage to run?
and:
What causes it to be skipped?
This is often where the real behavior of the pipeline is hidden.
A deployment stage may exist in the configuration but execute only for:
main branch
+
successful tests
+
approved release
Without checking those conditions, you may misunderstand the pipeline completely.
Step 15: Understand Jobs and Steps
Different platforms use different terminology, but the basic hierarchy is usually similar.
Think of it as:
Pipeline
   ↓
Stage
   ↓
Job
   ↓
Step
For example:
Pipeline
 └── Build Stage
      └── Build Job
           ├── Checkout
           ├── Install Dependencies
           ├── Compile
           └── Test
You don’t need to become attached to the terminology.
Just understand the hierarchy.
A stage represents a larger phase.
A job represents a unit of work.
A step is an individual action.
Step 16: Look for Parallel Execution
Not everything needs to happen sequentially.
For example:
             ┌── Unit Tests
Build ───────┼── Security Scan
             └── Lint
These tasks may run in parallel.
That can reduce pipeline execution time.
But parallelism introduces dependencies.
For example:
              ┌── Unit Test ────┐
Build ────────┤                 ├── Package
              └── Security ────┘
The package stage waits for the required jobs to finish.
When looking at a complex pipeline, identify:
- What runs first?
- What can run simultaneously?
- What depends on what?
- Which failure stops downstream work?
This gives you the execution graph.
Step 17: Understand Manual Approvals
Production releases may include a human approval point.
For example:
Build
 ↓
Test
 ↓
Staging
 ↓
Smoke Test
 ↓
Manual Approval
 ↓
Production
This can be appropriate when a production release requires an explicit business or operational decision.
But adding approval gates everywhere is not automatically a sign of maturity.
If every small change requires multiple people to click approval buttons, the pipeline becomes slow and operationally expensive.
A better question is:
Which decisions require human judgment, and which decisions can be automated safely?
Automate objective checks.
Keep human involvement where context or accountability genuinely matters.
Step 18: Understand Deployment Verification
One of the most common mistakes in pipeline design is treating a successful deployment command as proof that the application is healthy.
It isn’t.
For example:
kubectl apply
      ↓
Command succeeds
      ↓
Application healthy?
      ↓
Maybe not
The deployment command may succeed while:
- Pods fail to start.
- Health checks fail.
- The application cannot connect to its database.
- A required external service is unavailable.
- Traffic is routed incorrectly.
- The application starts but returns errors.
So a mature pipeline should verify the application after deployment.
For example:
Deploy
  ↓
Health Check
  ↓
Smoke Test
  ↓
Verify Metrics
  ↓
Release Successful
The key distinction is:
Infrastructure accepted the deployment does not necessarily mean users can successfully use the application.
Step 19: Understand Rollback
Now ask the question many beginners forget:
What happens when production deployment fails?
Possible recovery mechanisms include:
- Redeploying the previous artifact
- Rolling back a Kubernetes deployment
- Switching traffic to the previous version
- Reverting a release
- Using blue-green deployment
- Reducing traffic to a canary version
A simple rollback flow is:
Version 2
   ↓
Production
   ↓
Health Check
   ↓
FAIL
   ↓
Rollback
   ↓
Version 1
Rollback should be designed before an incident happens.
A production team should know:
- What version was previously running?
- Where is the previous artifact?
- How is it restored?
- How long does rollback take?
- What data changes cannot be reversed?
The last question matters particularly for database migrations. Rolling back application code does not automatically reverse a database schema or data change.
Step 20: Learn the Difference Between CI and CD
Understanding CI and CD separately makes pipelines much easier to follow.
Continuous Integration
CI focuses on validating changes.
Code Commit
    ↓
Build
    ↓
Test
    ↓
Quality Checks
    ↓
Artifact
The goal is to find problems early.
Continuous Delivery
Continuous delivery means the software is kept in a state where it can be released when the organization chooses.
Artifact
   ↓
Testing
   ↓
Staging
   ↓
Ready for Production
A production release may still require approval.
Continuous Deployment
Continuous deployment goes one step further.
Code
 ↓
Build
 ↓
Test
 ↓
Checks
 ↓
Production
A qualifying change is automatically deployed to production.
The terminology is important, but the bigger point is to understand how far the automation goes.
A Complete Example: Reading a Realistic Pipeline
Imagine you find this pipeline:
Developer Push
      ↓
Checkout
      ↓
Build Java Application
      ↓
Unit Tests
      ↓
Security Scan
      ↓
Build Docker Image
      ↓
Push Image to Registry
      ↓
Deploy to Staging
      ↓
Smoke Tests
      ↓
Approval
      ↓
Deploy to Production
      ↓
Health Check
Let’s translate it into plain English.
Developer Push
A developer changes the application and pushes code.
Checkout
The pipeline retrieves that version of the source code.
Build Java Application
The application is compiled and packaged.
Unit Tests
Automated tests verify application behavior.
Security Scan
The pipeline checks for relevant security issues.
Build Docker Image
The application is packaged into a container image.
Push Image
The image is stored in a container registry.
Deploy to Staging
The image is deployed into a non-production environment.
Smoke Tests
Basic tests verify that the deployed application responds correctly.
Approval
A release decision is required before production.
Deploy to Production
The same approved image is deployed.
Health Check
The pipeline verifies that the production application is actually healthy.
Once you can explain each stage in simple language like this, you understand the pipeline.
How to Troubleshoot a Pipeline Quickly
Pipeline troubleshooting becomes much easier when you treat the pipeline as a chain of transformations.
Think:
Source
  ↓
Build
  ↓
Test
  ↓
Artifact
  ↓
Registry
  ↓
Deployment
  ↓
Application
Then locate the broken handoff.
If Build Fails
Check:
- Source code
- Dependencies
- Compiler/runtime version
- Build configuration
- Missing tools
If Tests Fail
Check:
- Application behavior
- Test assumptions
- Environment configuration
- Test data
- External dependencies
If Artifact Upload Fails
Check:
- Registry URL
- Authentication
- Permissions
- Network connectivity
- Artifact naming
If Deployment Fails
Check:
- Deployment configuration
- Credentials
- Target environment
- Image availability
- Resource limits
- Permissions
If Deployment Succeeds but Application Fails
Check:
- Application logs
- Health checks
- Environment variables
- Secrets
- Database connectivity
- External dependencies
- Network configuration
This is a much better troubleshooting approach than repeatedly rerunning the pipeline and hoping it works.
How to Understand Kubernetes Pipelines
If your pipeline deploys to Kubernetes, add another layer to your mental model.
Think:
Source Code
     ↓
Build
     ↓
Docker Image
     ↓
Container Registry
     ↓
Kubernetes Deployment
     ↓
Pod
     ↓
Service
     ↓
Ingress / Load Balancer
     ↓
User
Now you can investigate failures systematically.
For example:
Image exists?
     ↓
Deployment updated?
     ↓
Pod running?
     ↓
Readiness check passing?
     ↓
Service routing?
     ↓
Application responding?
This is much easier than treating Kubernetes deployment as one mysterious pipeline command.
How to Understand Advanced Deployment Strategies
Once the basic pipeline makes sense, you can learn more advanced strategies.
Blue-Green Deployment
Two versions or environments are maintained:
Blue  → Current Version
Green → New Version
Traffic is switched after the new version has been validated.
The main benefit is that the previous environment can remain available for recovery.
Canary Deployment
The new version receives only a portion of traffic initially.
Users
 ├── 95% → Old Version
 └── 5%  → New Version
If the new version behaves correctly, traffic can gradually increase.
5%
 ↓
25%
 ↓
50%
 ↓
100%
The pipeline therefore becomes connected to application monitoring and release decisions.
A 30-Minute Method for Understanding an Unknown Pipeline
If you have been given an unfamiliar enterprise pipeline, use this process.
First 5 Minutes: Identify the Trigger
Write down:
Trigger:
Branch:
Repository:
Don’t investigate individual commands yet.
Next 5 Minutes: Identify the Stages
Reduce the pipeline to:
Build
Test
Scan
Package
Deploy
Verify
Next 5 Minutes: Follow the Artifact
Find:
Artifact:
Version:
Repository:
Deployment target:
Next 5 Minutes: Follow Environments
Write:
Dev → QA → Staging → Productionor whatever flow the organization actually uses.
Next 5 Minutes: Find Controls
Look for:
- Conditions
- Approvals
- Secrets
- Permissions
- Quality gates
Final 5 Minutes: Find Failure Recovery
Answer:
How is failure detected?
Where does the pipeline stop?
Is retry available?
Is rollback available?
How is application health verified?
You now have the pipeline’s operational picture.
Only after this should you start studying the individual YAML statements or scripts.
The Best Way to Practice
Reading pipelines is useful, but building small ones is much faster for learning.
Start with:
Git Push
   ↓
Build
   ↓
Test
Then add:
ArtifactThen:
Docker ImageThen:
Container RegistryThen:
DeploymentThen:
Health CheckFinally introduce:
Security Scan
Approval
Rollback
At each stage, ask:
- What is the input?
- What happens here?
- What is the output?
- What can fail?
- What happens after failure?
- How do we verify success?
That exercise builds much stronger DevOps understanding than simply memorizing pipeline syntax.
Common Mistakes When Learning DevOps Pipelines
1. Trying to Understand Every Line
A large pipeline can contain hundreds of lines.
Start with the flow.
2. Memorizing Commands
Knowing docker build does not mean you understand the delivery process.
Understand:
Why is the image built?
What is inside it?
Where is it stored?
Which version is deployed?
3. Ignoring the Artifact
If you don’t know what is moving between environments, you will struggle to understand CD.
4. Ignoring Conditions
A stage may exist but only execute for a specific branch, tag, environment, or event.
5. Ignoring Secrets
Credentials and permissions can be just as important as the deployment commands themselves.
6. Assuming a Successful Command Means a Successful Release
Always distinguish:
Deployment completedfrom:
Application is healthy7. Learning Advanced Strategies Too Early
Don’t begin with canary deployments, GitOps, progressive delivery, and complex release orchestration.
First understand:
Build
 ↓
Test
 ↓
Artifact
 ↓
Deploy
 ↓
Verify
Everything else builds on this foundation.
The DevOps Pipeline Mental Model You Should Remember
If you remember only one diagram from this tutorial, remember this:
             SOFTWARE DELIVERY FLOW

Developer
    ↓
Git Repository
    ↓
Build
    ↓
Test
    ↓
Security / Quality Checks
    ↓
Artifact
    ↓
Artifact Repository
    ↓
Environment
    ↓
Deployment
    ↓
Health Check
    ↓
Production
    ↓
Monitoring
    ↓
Feedback
And remember that every arrow represents a possible failure point.
For example:
Git → BuildCould fail because of source code or dependencies.
Build → ArtifactCould fail because packaging failed.
Artifact → DeploymentCould fail because of permissions or configuration.
Deployment → ApplicationCould fail because the application itself is unhealthy.
Thinking this way makes pipeline troubleshooting much more structured.
DevOps Pipeline Checklist
When someone asks you to explain an unfamiliar pipeline, check the following.
Trigger
- What starts the pipeline?
- Which branch or event?
- Can it be started manually?
Source
- Which repository?
- Which commit?
- Which branch or tag?
Execution
- Which runner or agent?
- Which runtime versions?
- Which tools are required?
Build
- What is being built?
- What dependencies are required?
- What is the output?
Testing
- Which tests run?
- What happens when they fail?
Security
- Are dependencies scanned?
- Are secrets protected?
- Are permissions restricted?
Artifact
- What artifact is produced?
- How is it versioned?
- Where is it stored?
Deployment
- Which environment?
- Which deployment mechanism?
- Is the same artifact promoted?
Controls
- Are there conditions?
- Are there quality gates?
- Are approvals required?
Verification
- Are health checks performed?
- Are smoke tests performed?
- Is application behavior verified?
Recovery
- Is rollback possible?
- Is the previous artifact available?
- What happens if a database migration is involved?
If you can answer these questions, you have a strong working understanding of the pipeline.
Final Takeaway
You don’t need to become an expert in Jenkins, GitHub Actions, GitLab CI, or Azure DevOps before you can understand DevOps pipelines.
Learn the delivery pattern first:
Code
 ↓
Build
 ↓
Test
 ↓
Scan
 ↓
Package
 ↓
Store
 ↓
Deploy
 ↓
Verify
 ↓
Promote or Roll Back
Then learn how your particular CI/CD platform implements each part.
When you encounter a new pipeline, don’t ask:
“What does every line of this YAML mean?”
Ask:
“What is this pipeline trying to move, where is it moving it, what controls that movement, and how does it know the result is safe?”
That change in perspective is what makes DevOps pipelines much easier to understand.
Once you can trace a change from Git commit → build → test → artifact → deployment → verification, you have the foundation needed to understand much more advanced topics such as Kubernetes deployments, GitOps, canary releases, blue-green deployments, automated rollback, and progressive delivery.
The syntax changes from one DevOps tool to another.
The delivery principles do not.

