Modern software engineering demands both speed and stability. High-performing engineering teams push code to production multiple times per day, yet end users expect web platforms, APIs, and mobile backends to remain continuously accessible without intermittent maintenance windows or service degradations. Delivering features quickly while preserving uninterrupted availability is one of the central objectives of modern DevOps. Achieving this balance requires an intentional release strategy. A deployment strategy defines how new application code, configurations, and artifacts transition from the developer’s workstation to production infrastructure serving live customer traffic. Among the available release techniques, Blue-Green Deployment stands out as an established, battle-tested paradigm for achieving zero-downtime releases and rapid disaster recovery. At its core, Blue-Green Deployment isolates the risks of software release by decoupling the deployment of application code from the release of that code to active users. For engineers, architects, and technical leaders refining their delivery workflows, platforms like DevOpsSchool provide structured training resources, technical certifications, and guided learning tracks covering modern deployment methodologies, cloud orchestration, and continuous delivery architectures.
Understanding how Blue-Green Deployment functions—from low-level network routing to shared persistent data stores—enables teams to architect resilient delivery pipelines, maintain operational confidence, and eliminate the anxiety historically associated with release days.
Understanding Blue-Green Deployment
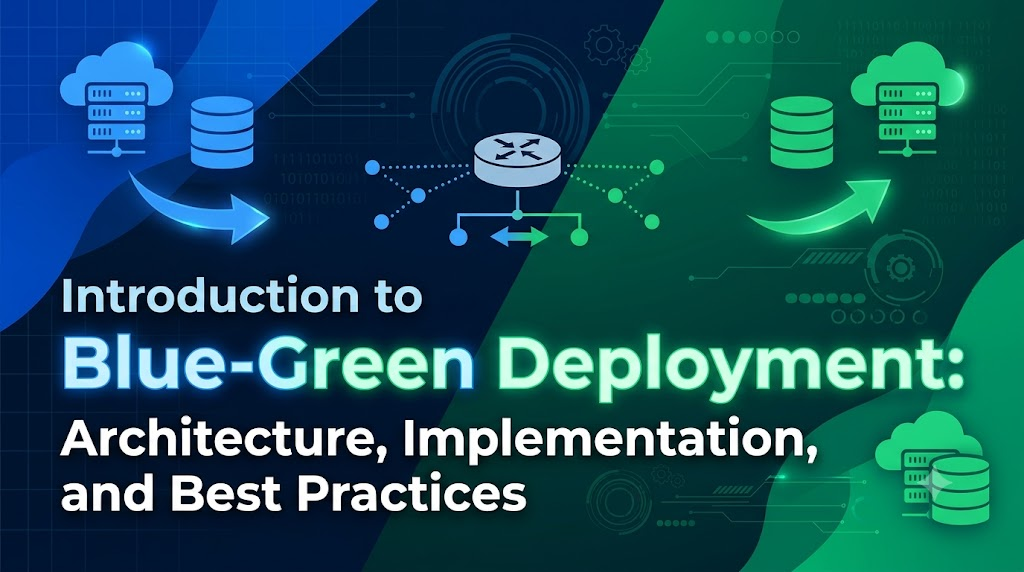
Blue-Green Deployment is a release orchestration strategy that utilizes two identical, production-grade infrastructure environments termed Blue and Green.
At any given point in the release lifecycle, only one of these environments actively serves production traffic to end users, while the other remains completely idle or dedicated to pre-release validation.
                   +-----------------------+
                   | Incoming User Traffic |
                   +-----------+-----------+
                               |
                               v
                     [ Load Balancer / DNS ]
                     [    Traffic Switch   ]
                               |
            +------------------+------------------+
            | (Active: 100%)                      | (Inactive: 0%)
            v                                     v
  +-------------------+                 +-------------------+
  | BLUE ENVIRONMENT  |                 | GREEN ENVIRONMENT |
  |   (Version 1.0)   |                 |   (Version 2.0)   |
  | Application Nodes |                 | Application Nodes |
  +---------+---------+                 +---------+---------+
            |                                     |
            +------------------+------------------+
                               |
                               v
                     [ Persistent Storage ]
                     [  Shared Databases  ]
The Blue and Green Roles
- The Active Environment (e.g., Blue): Runs the current stable version of the application (e.g., Version 1.0). All production requests, user sessions, and third-party API calls resolve to this environment.
- The Inactive Environment (e.g., Green): Serves as an isolated staging ground hosting the newly built release artifact (e.g., Version 2.0). It receives zero external customer traffic during normal operations.
When an engineering team builds a new feature set or patch, they deploy the artifact directly into the inactive Green environment. Because Green is structurally identical to Blue—matching its operating system versions, runtime dependencies, networking policies, and compute scale—the team can run smoke tests, synthetic integration workflows, and performance benchmarks against actual production-grade infrastructure without exposing active customers to unverified code.
Once the testing suite validates that Green is healthy, performant, and stable, traffic is redirected from Blue to Green at the routing layer (using a load balancer, reverse proxy, or DNS switch). Instantly, Green becomes the active environment serving Version 2.0, while Blue transitions into the standby role holding Version 1.0.
If an unexpected critical regression surfaces after cutover, the router simply reverts traffic back to Blue, executing an instantaneous rollback without needing to rebuild or redeploy older code packages.
Why Traditional Deployment Methods Can Be Risky
Before modern continuous delivery patterns gained wide adoption, traditional deployment approaches often relied on in-place upgrades. In an in-place deployment, automation tools or system administrators log into live servers, halt running application processes, overwrite binaries or scripts on disk, apply environment changes, and restart the processes.
While conceptually straightforward and resource-efficient, in-place deployments introduce severe operational risks:
- Application Downtime During Deployment: Halting the running process to overwrite files invariably disrupts live user requests. Even if scheduled during low-traffic windows (such as midnight on weekends), users encounter HTTP 502/503 errors or maintenance screens, eroding customer trust and violating strict Service Level Agreements (SLAs).
- Failed Releases and Difficult Recovery: If a newly deployed package fails to start—or encounters a fatal runtime exception under load—recovering the environment is complex and time-consuming. Engineers must manually track down older software binaries, reinstall previous package dependencies, revert configuration files, and restart the service, all while the system is down.
- Configuration Inconsistencies and Drift: Manual steps or long-lived servers frequently suffer from configuration drift. Discrepancies between servers in an application pool can lead to scenarios where a release succeeds on some hosts but crashes on others due to minor library version mismatches or missing environment variables.
- Limited Production-Grade Testing: Staging environments rarely match production in terms of scale, network topology, firewall rules, and cloud security policies. Testing exclusively in pre-production often leaves hidden latency issues, permissions failures, and integration bugs undetected until the artifact hits live production servers.
- Operational Fatigue and Release Anxiety: High-risk deployments turn releases into high-stress events requiring large “war rooms” of engineers, operators, and support personnel working late hours. This anxiety causes organizations to batch releases into massive, infrequent deployments, exponentially increasing the failure blast radius when changes finally ship.
Modern deployment strategies mitigate these failure modes by isolating the release process from active production operations. By establishing dedicated environments for validation and implementing dynamic traffic switching, engineering teams can replace manual risk with predictable, automated systems.
How Blue-Green Deployment Works
The mechanics of a Blue-Green deployment follow a structured operational cadence. By walking through a standard deployment cycle, teams can observe how environment roles alternate across versions.
PHASE 1: BASELINE
   Traffic ---> [ Router ] ---> [ Blue: v1.0 (Live) ]
                                [ Green: Idle       ]

PHASE 2: PREPARATION & DEPLOYMENT
   Traffic ---> [ Router ] ---> [ Blue: v1.0 (Live) ]
                                [ Green: v2.0 (Deploying) ]

PHASE 3: PRE-RELEASE VALIDATION
   Traffic ---> [ Router ] ---> [ Blue: v1.0 (Live) ]
   Internal QA --------------> [ Green: v2.0 (Testing via Private Endpoint) ]

PHASE 4: TRAFFIC CUTOVER
   Traffic ---> [ Router ] -+   [ Blue: v1.0 (Standby) ]
                            |
                            +-> [ Green: v2.0 (Live) ]

PHASE 5: POST-RELEASE STABILITY
   Traffic ---> [ Router ] ---> [ Green: v2.0 (Live) ]
                                [ Blue: v1.0 (Retained for rollback or decommissioned) ]
The Step-by-Step Cycle
- Baseline State: Blue is running the current production version ($v1.0$). The entry load balancer points all external traffic to Blue. Green is idle, holding either an older software release or running minimal baseline compute.
- Target Provisioning and Deployment: The Continuous Deployment (CD) pipeline targets Green. It provisions necessary compute resources (or reuses existing standby instances) and deploys application package $v2.0$ alongside updated runtime configurations.
- Internal Validation: With Green fully running $v2.0$, automated test harnesses and internal QA teams query Green directly via a private, non-public endpoint or internal test header. Green executes end-to-end integration flows, health checks, and database reads. Active users remain on Blue, completely unaffected.
- Traffic Cutover: Once Green passes all validation thresholds, the routing layer updates its target configuration. The load balancer dynamically shifts external requests from the Blue compute pool to the Green compute pool.
- Standby and Observation: Blue is not terminated immediately. It remains online, idle, and preserved in its exact pre-deployment state. Should Green exhibit memory leaks, elevated error rates, or performance anomalies, traffic can be redirected back to Blue within seconds.
- Cycle Completion: Once Green demonstrates operational stability over a predefined observation period, Blue is marked as the new inactive environment. In the next release cycle ($v3.0$), the roles reverse: Blue receives the update while Green acts as the live host.
Understanding Blue and Green Environments
To execute a dependable Blue-Green deployment, both environments must be constructed with architectural parity. If the staging environment diverges from the live environment in its network topology, resource limits, or runtime dependencies, validation results become untrustworthy.
+-----------------------------------------------------------------------------------+
| SHARED INGRESS / TRAFFIC MANAGEMENT LAYER                                          |
| (Cloud Load Balancer, Ingress Controller, Reverse Proxy, Route 53 / DNS)          |
+-----------------------------------------------------------------------------------+
             |                                                  |
             v                                                  v
+----------------------------------+    +----------------------------------+
| BLUE ENVIRONMENT (Current Live)  |    | GREEN ENVIRONMENT (Target Staging)|
|----------------------------------|    |----------------------------------|
| Application Instances (Compute)  |    | Application Instances (Compute)  |
| Operating System & Runtimes      |    | Operating System & Runtimes      |
| Environment Configurations       |    | Environment Configurations       |
| Secret Stores / Vault Mappings   |    | Secret Stores / Vault Mappings   |
| Local Cache Layers (e.g., Redis) |    | Local Cache Layers (e.g., Redis) |
+----------------------------------+    +----------------------------------+
             |                                                  |
             +------------------------+-------------------------+
                                      |
                                      v
+-----------------------------------------------------------------------------------+
| SHARED STATE & PERSISTENT DATA LAYER                                              |
| (Relational DBs, Managed Object Storage, Event Brokers, Cloud VPC Peering)        |
+-----------------------------------------------------------------------------------+
Core Environment Components
An operational Blue-Green topology consists of several discrete tiers:
- Compute and Runtime Instances: Whether deployed on virtual machines (VMs), bare-metal servers, or containerized pods, both Blue and Green require dedicated compute allocations capable of handling 100% of production peak traffic independently.
- Ingress and Routing Layer: The gateway positioned upstream of the compute nodes. This layer must support programmatic updates, allowing automated pipelines to manipulate routing tables, target groups, or upstream blocks without dropping active network sockets.
- Configuration Management and Secrets: Both environments must fetch configurations (feature flags, timeouts, log levels) and secrets (API keys, encryption tokens) systematically from centralized secret managers rather than baking them immutably into base machine images.
- Shared Storage and Database Systems: Unlike the stateless compute tier, persistent data stores—such as relational databases, transactional caches, and object buckets—are typically shared between Blue and Green. Duplicating production databases into separate Blue and Green silos is generally impractical due to data synchronization lag and transaction loss risks.
The Importance of Environment Parity
The core premise of Blue-Green Deployment rests on the confidence that an application passing tests in the inactive environment will behave identically when receiving live customer requests.
Deviations in OS kernel versions, CPU/memory limits, ephemeral disk speeds, or firewall rules introduce “environment drift.” If Green has higher memory allocations or different network routes than Blue, an artifact might pass internal tests on Green but fail catastrophically if rolled back to a smaller Blue environment.
Teams manage this consistency by defining infrastructure as code (IaC) using tools like Terraform, OpenTofu, or AWS CloudFormation, ensuring that both environments are spun up from identical, declarative configurations.
Blue-Green Deployment Workflow: From Build to Release
A reliable Blue-Green release involves coordinated interactions between developers, source control, continuous integration runners, deployment orchestrators, and network infrastructure.
[ Developer ]
      |
      | 1. Git Commit & Push
      v
[ CI Server ] ----------------------------------------------+
      |                                                     |
      | 2. Unit Testing & Static Analysis                   |
      v                                                     | Artifact Packaging
[ Build Stage ]                                             | (Docker Image / AMI)
      |                                                     |
      | 3. Publish to Artifact Registry                     |
      v                                                     |
[ CD Orchestrator ] <---------------------------------------+
      |
      | 4. Deploy Artifact to Inactive Environment (Green)
      v
[ Green Environment ]
      |
      | 5. Execute Automated Smoke & Integration Suites
      v
[ Validation Gate ] -- (Pass) --> [ 6. Update Load Balancer Target ]
      |                                       |
   (Fail)                                     v
      |                              [ Green Serves 100% Traffic ]
      v                                       |
[ Abort & Alert ]                             | 7. Telemetry & Metrics Verification
                                              v
                                     [ Stable or Rollback? ]
                                    /                       \
                       (All Metrics Healthy)          (Elevated Error Rate)
                                  /                               \
                                 v                                 v
                     [ 8a. Confirm Release ]            [ 8b. Shift Back to Blue ]
1. Developer Commits Code
Engineers merge pull requests into the trunk or release branch. The code change includes application logic, configuration changes, and any necessary backward-compatible database schema migrations.
2. CI Pipeline Builds and Tests
The continuous integration engine (such as GitHub Actions, GitLab CI, or Jenkins) detects the merge, triggers automated test suites (unit, security, and linting), and compiles the application binaries.
3. Deployable Artifact Creation
The build system packages the application into an immutable, versioned artifact—such as an OCI-compliant container image, a Debian package, or a golden VM image (AMI). This artifact is tagged (e.g., :v2.1.0) and stored in a secure artifact registry.
4. Deployment to Inactive Environment
The continuous delivery engine determines which environment is currently idle. If Blue is currently live, the CD pipeline targets Green. It provisions or updates the workloads on Green with the newly minted :v2.1.0 artifact, keeping Blue completely undisturbed.
5. Automated Validation and Health Verification
Before any customer traffic is redirected, automated testing frameworks run against Green’s internal, isolated endpoints:
- Liveness & Readiness Probes: Ensure runtime processes are running and ready to accept connections.
- Smoke Testing: Validates primary business transactions (e.g., authentication, checkout, search query) against live backend dependencies.
- Synthetic Monitoring: Verifies third-party integration points and verifies application telemetry generation.
6. Traffic Switching
If all validation stages pass, the deployment tool executes an automated instruction to the routing layer. The ingress controller or load balancer shifts incoming traffic targets from Blue to Green.
7. Telemetry and Post-Cutover Verification
For a designated period (often 15 to 60 minutes), monitoring systems observe real-time production metrics: HTTP status distributions (5xx and 4xx spikes), latency percentiles ($p95$, $p99$), database connection saturation, and unhandled exception logs.
8. Rollback or Finalization
- If metrics degrade: The CD pipeline or an on-call engineer triggers a rollback. The router immediately points back to Blue, which is still running the known-stable $v1.0$ version.
- If metrics remain stable: The release is declared complete. Blue is powered down, scaled to zero, or kept on warm standby to receive the subsequent release ($v3.0$).
The Role of Load Balancers and Traffic Routing
The core mechanism enabling Blue-Green Deployment is dynamic traffic manipulation. Rather than changing the servers that handle requests, teams change where incoming network requests are sent.
                        [ Ingress Traffic ]
                                 |
                                 v
                 +-------------------------------+
                 | Layer 7 Application           |
                 | Load Balancer / Reverse Proxy |
                 +---------------+---------------+
                                 |
                     +-----------+-----------+
                     | Routing Rules Table   |
                     | Active Target: Green  |
                     | Standby Target: Blue  |
                     +-----------------------+
                                 |
           +---------------------+---------------------+
           |                                           |
           v (Target Group A)                          v (Target Group B)
+-----------------------+                   +-----------------------+
|   BLUE ENVIRONMENT    |                   |   GREEN ENVIRONMENT   |
| Instance 1 (10.0.1.5) |                   | Instance 1 (10.0.2.5) |
| Instance 2 (10.0.1.6) |                   | Instance 2 (10.0.2.6) |
| Connection Draining:  |                   | Active Connections:   |
| Finishing old sockets |                   | Accepting new requests|
+-----------------------+                   +-----------------------+
Ingress Routing Mechanisms
Traffic routing can occur at different layers of the OSI networking stack:
| Routing Layer | Mechanism | Switch Speed | Key Considerations |
| DNS-Level | Amazon Route 53, Cloudflare, Azure DNS | Minutes to Hours | Dependent on client DNS resolvers honoring Time-To-Live (TTL) values. Inconsistent client caching can cause traffic to hit both versions simultaneously. |
| Layer 4 (Transport) | Network Load Balancers (NLB), HAProxy | Milliseconds | Extremely fast IP/TCP switching; lacks HTTP header inspection and application-aware path routing. |
| Layer 7 (Application) | AWS ALB, NGINX, Traefik, Envoy, F5 | Milliseconds | Highly flexible. Supports HTTP-based routing, header-based test routing, cookie pinning, and zero-downtime cutovers. |
| Service Mesh / Ingress | Istio, Linkerd, Kubernetes Ingress-NGINX | Sub-second | Allows granular percentage splits, header matching, and programmatic control via declarative Kubernetes Custom Resource Definitions (CRDs). |
Connection Draining and In-Flight Requests
An abrupt traffic switch risks terminating active TCP sockets, severing long-running file uploads, API requests, and web sessions. Production load balancers address this through connection draining (also known as deregistration delay).
When the load balancer flips its target from Blue to Green:
- It stops sending new connections to Blue.
- It allows all existing, in-flight requests on Blue to finish processing within a configurable timeout period (e.g., 30 to 300 seconds).
- Once all active requests on Blue terminate gracefully or hit the timeout window, the environment enters a clean standby state.
Session Persistence and State
Applications relying on in-memory user sessions create challenges during traffic switches. If a user’s session is stored locally on a Blue instance and the load balancer suddenly routes their next request to Green, the user is logged out or loses shopping cart state.
To ensure clean transitions, engineering teams should decouple session state from compute nodes by:
- Storing sessions in distributed key-value caches (such as Redis or Memcached).
- Implementing stateless authentication tokens (such as cryptographically signed JWTs).
- Configuring sticky sessions with graceful expiration windows if distributed state is not yet supported.
Implementing Blue-Green Deployment with CI/CD
Continuous Integration and Continuous Delivery (CI/CD) pipelines eliminate the risk of human error during complex release cutovers. A declarative pipeline automates provisioning, testing, routing reconfiguration, and teardown.
Example Declarative Pipeline (GitHub Actions Style)
Below is a simplified pipeline demonstrating an automated Blue-Green cutover targeting an application load balancer:
YAML
name: Production Blue-Green Deployment

on:
  push:
    branches:
      - main

jobs:
  build-and-test:
    runs-on: ubuntu-latest
    steps:
      - name: Checkout Code
        uses: actions/checkout@v4

      - name: Compile and Run Unit Tests
        run: |
          npm ci
          npm test

      - name: Build and Push Container Image
        id: build
        run: |
          IMAGE_TAG=${{ github.sha }}
          docker build -t registry.internal/app:${IMAGE_TAG} .
          docker push registry.internal/app:${IMAGE_TAG}
          echo "image_tag=${IMAGE_TAG}" >> $GITHUB_OUTPUT

  deploy-to-green:
    needs: build-and-test
    runs-on: ubuntu-latest
    steps:
      - name: Determine Inactive Environment
        id: environment-discovery
        run: |
          ACTIVE_COLOR=$(curl -s https://api.internal/routing/current-active)
          if [ "$ACTIVE_COLOR" = "blue" ]; then
            echo "target=green" >> $GITHUB_OUTPUT
            echo "target_port=8082" >> $GITHUB_OUTPUT
          else
            echo "target=blue" >> $GITHUB_OUTPUT
            echo "target_port=8081" >> $GITHUB_OUTPUT
          fi

      - name: Deploy Artifact to Standby Cluster
        run: |
          TARGET=${{ steps.environment-discovery.outputs.target }}
          echo "Deploying ${{ needs.build-and-test.outputs.image_tag }} to ${TARGET}..."
          ansible-playbook deploy.yml --extra-vars "env=${TARGET} image=${{ needs.build-and-test.outputs.image_tag }}"

      - name: Execute Synthetic Health Checks
        run: |
          TARGET_PORT=${{ steps.environment-discovery.outputs.target_port }}
          echo "Validating health on internal port ${TARGET_PORT}..."
          for i in {1..10}; do
            STATUS=$(curl -o /dev/null -s -w "%{http_code}\n" http://127.0.0.1:${TARGET_PORT}/healthz)
            if [ "$STATUS" -eq 200 ]; then
              echo "Health check passed!"
              exit 0
            fi
            sleep 5
          done
          echo "Health checks failed on target environment."
          exit 1

      - name: Shift Production Traffic
        run: |
          TARGET=${{ steps.environment-discovery.outputs.target }}
          echo "Switching load balancer target to ${TARGET}..."
          curl -X POST https://api.internal/routing/switch -d "active=${TARGET}"

      - name: Post-Release Telemetry Verification
        run: |
          echo "Monitoring error rates for 5 minutes..."
          python3 scripts/verify-telemetry.py --threshold-error-rate=0.01 --window=300
Automating this pipeline ensures that every validation gate must explicitly pass before the traffic-switching command runs. If the health check or telemetry verification fails, the pipeline halts immediately, leaving production users uninterrupted on the original environment.
Blue-Green Deployment in Cloud and Kubernetes Environments
Implementation details for Blue-Green Deployment vary based on the underlying infrastructure platform.
Virtual Machines and Traditional Infrastructure
In traditional on-premises setups or basic IaaS setups, running two static pools of virtual machines (e.g., 20 VMs for Blue, 20 VMs for Green) can be expensive. Teams often manage this by updating an NGINX, HAProxy, or F5 configuration file via Ansible or Chef, reloading the proxy daemon (nginx -s reload) to shift connections between upstream server pools.
Cloud Environments (AWS, Azure, GCP)
Major cloud providers offer native primitives to simplify Blue-Green workflows:
- Amazon Web Services (AWS): AWS Route 53 weighted record sets allow DNS-level shifts. AWS Application Load Balancers (ALBs) provide a cleaner approach: an automated pipeline can adjust Target Group weights, routing 100% of traffic from the Blue Target Group to the Green Target Group. Services like AWS Elastic Beanstalk and AWS CodeDeploy include built-in Blue-Green deployment orchestrators out of the box.
- Microsoft Azure: Azure App Service provides Deployment Slots. A team deploys new builds to a “Staging” slot. Once verified, executing a “Swap” operation exchanges the virtual IP addresses and underlying routing tables between the Staging and Production slots instantly, without dropped packets.
- Google Cloud Platform (GCP): Google Cloud Load Balancing supports traffic steering across backend services. Google Cloud Deploy and Cloud Run enable service-level traffic updates where engineers can instantly route incoming requests to a newly deployed, immutable service revision.
Kubernetes Clusters
In Kubernetes, Blue-Green deployments are exceptionally clean and cost-effective because containers can be spun up, validated, and torn down on demand using shared cluster compute.
The most common Kubernetes implementation relies on manipulating Service Selectors:
[ Ingress Controller ]
          |
          v
[ Kubernetes Service ]
  selector:
    app: web-app
    version: v1.0   <--- (Switching this label selector to v2.0 redirects all pods instantly)
          |
    +-----+-----+
    |           |
    v           v
[ Blue Pod ] [ Blue Pod ]       [ Green Pod ] [ Green Pod ]
  labels:      labels:            labels:       labels:
  version:v1.0 version:v1.0       version:v2.0  version:v2.0
Step 1: Blue Deployment Running Active Version ($v1.0$)
YAML
apiVersion: apps/v1
kind: Deployment
metadata:
  name: web-app-blue
  labels:
    app: web-app
    color: blue
spec:
  replicas: 3
  selector:
    matchLabels:
      app: web-app
      color: blue
  template:
    metadata:
      labels:
        app: web-app
        color: blue
    spec:
      containers:
      - name: web
        image: registry.internal/web-app:1.0.0
        ports:
        - containerPort: 8080
Step 2: The Kubernetes Service Directing Traffic to Blue
YAML
apiVersion: v1
kind: Service
metadata:
  name: web-app-production-service
spec:
  type: ClusterIP
  selector:
    app: web-app
    color: blue  # Traffic hits Pods with label "color: blue"
  ports:
  - protocol: TCP
    port: 80
    targetPort: 8080
Step 3: Deploying Green ($v2.0$) Alongside Blue
The pipeline creates web-app-green with color: green and image: registry.internal/web-app:2.0.0. While it deploys, the production service continues pointing exclusively to color: blue.
A secondary, private service (web-app-test-service) targeting color: green can be used to run automated smoke tests against the new pods.
Step 4: The Cutover
To perform the release, the pipeline applies a single update to the production service selector:
YAML
apiVersion: v1
kind: Service
metadata:
  name: web-app-production-service
spec:
  selector:
    app: web-app
    color: green  # Switched to green: traffic shifts immediately
Kubernetes’ internal kube-proxy and endpoints controller update the endpoints list across the cluster. User requests immediately resolve to the Green pods. If an issue occurs, applying color: blue instantly rolls back the deployment.
Managing Database Changes and Persistent Data
While shifting stateless application compute is straightforward, database management represents the most complex technical hurdle in Blue-Green deployments.
In a standard setup, both Blue and Green share the same operational database tier to prevent data loss and synchronization drift. This architectural constraint introduces a critical rule: The database schema must remain compatible with both the old (Blue) and new (Green) application versions simultaneously.
+--------------------+        +--------------------+
|  BLUE ENVIRONMENT  |        | GREEN ENVIRONMENT  |
|   (Version 1.0)    |        |   (Version 2.0)    |
+---------+----------+        +---------+----------+
          |                             |
          | Read/Write                  | Read/Write
          | (Old Fields)                | (New & Old Fields)
          +--------------+--------------+
                         |
                         v
             +-----------------------+
             |   SHARED DATABASE     |
             |-----------------------|
             | Users Table:          |
             | - id                  |
             | - full_name (old)     |
             | - first_name (new)    |
             | - last_name (new)     |
             +-----------------------+
The Rollback Reality Check
Critical Architecture Principle:
Switching application traffic back to Blue does not automatically reverse database migrations. If a release is aborted after data has been written in a new format, the old version of the application must still be able to read and process that data without crashing.
Breaking schema changes—such as dropping a column, renaming a field, or splitting a table—will immediately crash the active Blue application if applied before the cutover, or crash the Blue application during a rollback after the cutover.
The Expand-and-Contract Migration Pattern
To safely introduce database changes alongside Blue-Green deployments, organizations use the Expand-and-Contract (or Parallel Run) pattern. This approach splits breaking changes across multiple non-breaking deployment cycles.
PHASE 1: EXPAND
Database: Add new column, keep old column intact.
Deployment: Deploy Green (writes to both old and new columns, reads from old).
Cutover: Blue and Green can both read/write safely.

PHASE 2: TRANSITION
Deployment: Update application to read from the new column and write to both.
Validation: Verify all queries run against the new column.

PHASE 3: CONTRACT
Deployment: Remove fallback code for the old column.
Database: Safely drop the old column once older versions are retired.
Step-by-Step Scenario: Splitting a Name Column
Consider an application that stores a user’s full name in a single full_name column. The team wants to split this into first_name and last_name.
- Step 1: Expand (Release N)
- Run a migration adding
first_nameandlast_nameas nullable columns. - Update the application code deployed to Green so that it writes to
full_name,first_name, andlast_nameconcurrently, but continues reading fromfull_name. - Cut over to Green. If a rollback to Blue occurs, Blue can still function because
full_nameremains up-to-date and populated.
- Run a migration adding
- Step 2: Backfill Data
- Run an asynchronous background migration script to parse existing
full_namerecords and populatefirst_nameandlast_namefor all historical rows.
- Run an asynchronous background migration script to parse existing
- Step 3: Transition (Release N+1)
- Deploy an update to Green where the application reads from
first_nameandlast_name. It continues writing to all three columns as a safeguard. - Cut over to Green.
- Deploy an update to Green where the application reads from
- Step 4: Contract (Release N+2)
- Once the release is fully validated and the rollback window closes, deploy an update that removes all references to
full_namefrom the codebase. - Run a final migration dropping the
full_namecolumn from the database.
- Once the release is fully validated and the rollback window closes, deploy an update that removes all references to
By strictly adhering to backward and forward compatibility, teams can roll back application traffic at any point without risking data corruption or schema-induced application crashes.
Benefits of Blue-Green Deployment
Adopting a Blue-Green deployment model delivers substantial advantages across engineering, operations, and business operations:
- Elimination of Maintenance Downtime: Applications can be updated during broad daylight and regular business hours. There is no need to display user-facing maintenance screens or schedule disruptive service windows.
- Instantaneous, Low-Risk Rollbacks: Rollbacks do not require rebuilding code, downloading artifacts, or rolling back package states. Reverting traffic takes seconds: simply toggle the load balancer or service selector back to the warm standby environment.
- Validation on True Production Infrastructure: Unlike staging setups, the inactive Green environment sits within the exact production VPC, connects to production networks, and uses identical hardware sizing. Smoke testing against this environment provides high confidence before users ever touch the release.
- Decoupling Deployment from Release: Engineering teams can deploy artifacts hours or days ahead of schedule, validating their operational health without making them available to users. The business can then execute the actual “release” (traffic switch) at a specific marketing or business milestone.
- Predictable, Stress-Free Operations: Because releases follow a standardized, automated routine with an instant rollback path, teams avoid high-pressure deployments. Operational anxiety drops significantly, leading to higher release frequency.
- Improved Team Alignment: Development, QA, and operations teams work against clear, unambiguous boundaries: developers package verified immutable artifacts, QA tests against production-grade environments, and operations oversees network routing and platform stability.
Limitations and Challenges to Consider
While powerful, Blue-Green Deployment is not a universal solution for every organization or application architecture. Teams should evaluate several operational trade-offs before adopting it:
- Resource and Infrastructure Cost: Running two concurrent, production-grade environments can significantly increase infrastructure costs. In static, bare-metal, or unoptimized VM architectures, compute costs can double. While containerization and dynamic cloud auto-scaling can mitigate this by provisioning the Green environment just-in-time, teams must account for baseline capacity overhead.
- Database Complexity: As highlighted in Section 9, database schemas must remain compatible across versions. Teams lacking the discipline or tooling to run expand-and-contract migrations may encounter data synchronization issues or find themselves unable to roll back safely.
- Configuration Drift Risks: If environments are maintained statically over long periods, Blue and Green can gradually drift apart in OS patches, disk layouts, or network settings. Without automated Infrastructure as Code (IaC), this divergence can lead to inconsistent application behavior.
- Asynchronous Jobs and Scheduled Workers: Web servers are not the only components of modern applications. If an application includes background consumers, cron workers, or event processors (e.g., Kafka or RabbitMQ workers), running both Blue and Green simultaneously can lead to duplicated task execution. Teams must coordinate queue consumers carefully to ensure only one environment consumes jobs at a time.
- Session and Cache Invalidation: If Version 2.0 alters the data structures cached within an external Redis or Memcached cluster, an active Blue environment (or a reverted rollback to Blue) may crash when attempting to deserialize unexpected data shapes.
- Suitability Constraints: Blue-Green deployments may be overly complex for lightweight internal tools, legacy stateful monoliths with tightly coupled local file systems, or resource-constrained embedded platforms where running dual instances is technically infeasible.
Blue-Green vs. Rolling vs. Canary Deployment
Modern continuous delivery features three primary deployment patterns: Blue-Green Deployment, Rolling Deployment, and Canary Deployment. Understanding their trade-offs helps teams choose the right strategy for their specific architecture.
BLUE-GREEN DEPLOYMENT (All-at-once environment switch)
Active:   [ v1 ] [ v1 ] [ v1 ]  ===> Traffic switch ===>  [ v2 ] [ v2 ] [ v2 ]
Inactive: [ v2 ] [ v2 ] [ v2 ]                            [ v1 ] [ v1 ] [ v1 ] (Standby)

ROLLING DEPLOYMENT (Incremental in-place replacement)
Step 1: [ v2 ] [ v1 ] [ v1 ]
Step 2: [ v2 ] [ v2 ] [ v1 ]
Step 3: [ v2 ] [ v2 ] [ v2 ]

CANARY DEPLOYMENT (Gradual percentage-based traffic routing)
Phase 1: 95% traffic to [ v1 ] [ v1 ] [ v1 ]  |  5% traffic to [ v2 ]
Phase 2: 75% traffic to [ v1 ] [ v1 ]        | 25% traffic to [ v2 ] [ v2 ]
Phase 3: 0% traffic  to [ v1 ]               | 100% traffic to [ v2 ] [ v2 ] [ v2 ]
Comprehensive Comparison Matrix
| Feature / Criteria | Blue-Green Deployment | Rolling Deployment | Canary Deployment |
| Deployment Approach | Deploys new version to a separate, complete environment; switches traffic all at once. | Replaces instances within the same environment incrementally one by one or in batches. | Deploys new version to a small subset of instances; routes a small fraction of real user traffic (e.g., 2%). |
| Traffic Management | All-or-nothing (0% to 100%) cutover via load balancer or router. | Traffic naturally distributes across both versions as pods/servers are incrementally replaced. | Granular percentage-based traffic splitting (e.g., 2% $\rightarrow$ 10% $\rightarrow$ 50% $\rightarrow$ 100%) via smart proxies. |
| Infrastructure Overhead | High (Requires up to 2x capacity during the deployment window). | Low (Requires minimal or no temporary surge capacity). | Low to Medium (Requires capacity only for the small canary subset). |
| Rollback Speed | Instantaneous (Revert load balancer route to the original standby environment). | Moderate (Requires rolling the deployment backwards instance by instance). | Fast (Cut off traffic to the canary instances and redirect to the baseline pool). |
| Validation Window | Pre-release testing on idle production infrastructure before exposing any users. | In-flight testing while a subset of production users are actively interacting with new code. | Deep statistical and telemetry analysis against real production user workloads. |
| Mixed-Version State | None. Users hit either 100% Blue or 100% Green. | Yes. Both versions run concurrently in production during the rolling window. | Yes. A controlled subset of users hits the new version while most stay on the old version. |
| Blast Radius of Bugs | Broad if cutover is premature, but impact duration is extremely brief due to instant rollback. | Moderate; affects only the users routed to updated instances during rollout. | Minimal; isolates anomalies to a tiny percentage of live user requests. |
| Ideal Use Cases | Mission-critical apps needing zero downtime, instant rollback, and no mixed-version states. | Resource-constrained architectures, microservices with broad backward compatibility. | Large-scale, high-traffic consumer web services, mobile backends, and complex distributed systems. |
Practical Example: Releasing a Web Application Using Blue-Green Deployment
To see Blue-Green Deployment in practice, let us examine an illustrative enterprise scenario: releasing an update to an e-commerce platform’s core catalog and payment service.
The Baseline Environment
- Platform: An e-commerce service handling 1,500 requests per second at peak.
- Infrastructure: AWS ECS (Elastic Container Service) running behind an Application Load Balancer (ALB).
- Database: Shared Amazon Aurora PostgreSQL cluster.
- Active Environment (Blue): 10 ECS tasks running container image
eshop-core:v1.4.2. Target Group:tg-eshop-bluereceiving 100% of ALB traffic. - Inactive Environment (Green): Scaled down to 0 tasks during idle days to save compute costs. Target Group:
tg-eshop-greenreceiving 0% of traffic.
                              [ ALB Ingress ]
                         DNS: shop.example.com
                                    |
                 +------------------+------------------+
                 | (100% Traffic)                      | (0% Traffic)
                 v                                     v
       [ Target Group Blue ]                 [ Target Group Green ]
       eshop-core:v1.4.2                     eshop-core:v2.0.0
       (10 Active Containers)                (10 Containers - Warmed & Tested)
                 |                                     |
                 +------------------+------------------+
                                    |
                                    v
                       [ Shared Aurora PostgreSQL ]
                       Schema: Expand-State Applied
The Release Execution Plan
Step 1: Pre-Deployment Schema Preparation
Two days before the release, the team runs an automated database migration applying additive, non-breaking schema updates (the “Expand” phase). The live v1.4.2 service does not use these new columns, so it continues serving requests without issue.
Step 2: Provisioning the Green Fleet
The continuous deployment orchestrator receives a trigger: deploy release eshop-core:v2.0.0.
- The orchestrator sets the desired task count for
tg-eshop-greento 10 containers. - The container engine pulls
eshop-core:v2.0.0and starts the instances. - The ALB registers the new tasks and marks them healthy based on internal container
/healthzendpoints.
Step 3: Isolated Pre-Cutover Testing
Before exposing customers to v2.0.0, the automated QA harness runs synthetic end-to-end tests against Green:
- The test harness sends requests directly to the ALB using a custom routing header:
X-Target-Pool: green-test. - A special routing rule directs requests containing this header directly to
tg-eshop-green. - Automated test suites verify authentication flows, catalog searches, and shopping cart operations against Green.
- All assertions pass within 4 minutes.
Step 4: The Cutover
The deployment tool issues an API call to the AWS ALB modifying the listener rule:
tg-eshop-green: Weight updated from 0 to 100.tg-eshop-blue: Weight updated from 100 to 0.- Connection draining is set to 60 seconds on
tg-eshop-blue.
Within milliseconds, all incoming customer requests are routed to v2.0.0. Existing in-flight checkouts on Blue finish processing cleanly before Blue ceases active execution.
Step 5: Post-Release Observation and Decision Gate
The operations team watches a unified monitoring dashboard covering key service telemetry:
[ METRICS DASHBOARD - FIRST 10 MINUTES POST-CUTOVER ]
HTTP 200 OK Rate:       99.98%   (Within baseline limits)
HTTP 5xx Server Errors: 0.01%    (Healthy)
p95 Response Latency:   142ms    (12ms faster than v1.4.2)
Database Connection Pool: 42%    (Normal operational headroom)
Memory Utilization:     58%      (Stable across all 10 containers)
Because telemetry indicates a healthy deployment, the decision gate automatically marks the release successful.
tg-eshop-blue remains online in warm standby for 60 minutes. After this observation window passes without incident, the pipeline scales Blue down to 0 tasks to conserve compute spend.
If error rates had breached 1% or latency had spiked past 500ms, the pipeline would have automatically flipped the ALB listener weights back to Blue, restoring stable operations in seconds while engineers investigated the Green logs.
Monitoring and Operational Best Practices
A deployment strategy is only as dependable as the observability framework behind it. Without comprehensive telemetry, teams cannot reliably assess whether an environment is genuinely healthy before, during, or after cutover.
Key Telemetry Dimensions to Monitor
- Application and Access Logs: Centralize logging (using Elasticsearch, OpenSearch, Grafana Loki, or Datadog) to capture unhandled exceptions, runtime stack traces, and database serialization errors that may not immediately impact high-level HTTP status codes.
- HTTP Error Distributions: Closely track the ratio of 4xx client errors and 5xx server errors. A sharp rise in HTTP 500 or 502 responses immediately after cutover is the clearest indicator of an unhealthy deployment.
- Latency Percentiles ($p95$, $p99$): Average response times hide outliers. Monitor high-percentile latency to detect database query regressions, resource contention, or thread starvation under real production workloads.
- Infrastructure Resource Saturation: Observe CPU utilization, memory consumption, network socket limits, and ephemeral disk I/O on the Green instances to ensure they handle active load without entering throttling states.
- Database Performance: Track connection pool utilization, query lock contention, and transaction commit times on shared database infrastructure.
Operational Guardrails
- Automate Rollback Triggers: Do not rely exclusively on human decisions during an active incident. Connect deployment tools to alerting engines. If error rates exceed a defined threshold (e.g., HTTP 5xx > 1%) for three consecutive minutes following cutover, trigger an automated rollback immediately.
- Use Deep Health Checks for Verification: Ensure your pre-cutover testing exercises critical paths rather than just shallow liveness checks. A shallow check (
return 200 OK) confirms only that the web server is running. A deep check tests whether the application can connect to the database, reach its caching layer, and sign outgoing requests. - Keep Environments Identical Through IaC: Enforce a strict policy: never modify an environment manually. All infrastructure configurations, firewall adjustments, and system packages must be declared in version-controlled Infrastructure as Code files to guarantee complete parity between Blue and Green.
Common Mistakes to Avoid
Even seasoned DevOps teams can encounter issues when implementing Blue-Green deployments. Being aware of common pitfalls helps protect production environments:
- Treating Both Environments as Identical Without Automated Verification: Assuming Green matches Blue without running automated configuration checks is a common point of failure. Minor drifts in Linux kernel parameters, local certificate stores, or environment variables can cause releases to fail under full load.
- Attempting Breaking Database Migrations in a Single Step: Applying a disruptive database migration right before a Blue-Green switch removes your safety net. If you drop a column that Blue requires, you crash your live system before the cutover. If you drop a column that Blue requires and Green fails, your rollback path is broken. Always use the Expand-and-Contract model.
- Premature Traffic Cutover: Shifting traffic before the new environment has warmed up its internal application caches, JIT runtimes, and connection pools can trigger an immediate latency spike, overwhelming database backends with connection requests.
- Forgetting Background Schedulers and Daemon Workers: Running background workers (such as task queue consumers or cron jobs) in both Blue and Green simultaneously often causes duplicate processing of messages, duplicated customer emails, or race conditions in data updates.
- Disabling Post-Cutover Monitoring: High-stress deployments often end with a sigh of relief the moment traffic switches. However, memory leaks, connection pool leaks, and deadlocks often take 15 to 45 minutes to materialize under sustained production load. Keep the war room or monitoring alerts active throughout the standby window.
- Assuming Rollback Is Completely Free: While traffic cutover back to Blue is technically simple, any transactions, user registrations, or payments processed on Green while it was active remain in the database. Engineers must verify that the older Blue application code can handle records created by Green without throwing exceptions.
- Leaving Inactive Environments Running Indefinitely: Failing to decommission or scale down standby environments when using cloud infrastructure can lead to surprise cloud bills, eroding the cost benefits of modern delivery pipelines.
Frequently Asked Questions (FAQ)
What is Blue-Green Deployment in DevOps?
Blue-Green Deployment is a continuous delivery release strategy that uses two identical production-grade environments (named Blue and Green). One environment serves live production traffic while the other hosts the newly deployed version for testing. Once validated, traffic is shifted to the new environment, minimizing downtime and enabling fast rollbacks.
Why are two separate environments used?
Two environments isolate the risks associated with deploying new code. By deploying to an inactive environment, teams can test, warm up, and validate a new release on true production infrastructure without exposing real users to untested changes or taking the active application offline.
Does Blue-Green Deployment eliminate application downtime?
Yes. When properly configured with application load balancers, reverse proxies, and connection draining, Blue-Green Deployment provides zero-downtime releases. The cutover happens at the network routing layer within milliseconds, without terminating active user connections or interrupting ongoing requests.
How does rollback work in Blue-Green Deployment?
Rollback is executed by redirecting the load balancer or router back to the original, known-stable environment. Because the previous environment remains online in warm standby throughout the release window, rollback is near-instantaneous and does not require rebuilding, downloading, or redeploying older code artifacts.
What is the difference between Blue-Green and Canary Deployment?
The primary difference lies in how traffic is cut over. Blue-Green Deployment switches 100% of user traffic from the old environment to the new environment all at once. Canary Deployment gradually shifts small percentages of traffic (e.g., 2%, 10%, 25%, 100%) to the new version, testing its stability against a small slice of real users before proceeding with a full rollout.
Can Blue-Green Deployment be implemented using Kubernetes?
Yes. Kubernetes is well suited for Blue-Green deployments. Teams can run two parallel Deployments (app-blue and app-green) within the same cluster and manage cutovers by simply updating the spec.selector label configuration in a fronting Kubernetes Service. Alternatively, ingress controllers and service meshes like Istio can orchestrate these shifts programmatically.
How are database migrations handled during Blue-Green deployments?
Database migrations must remain backward- and forward-compatible with both the Blue and Green application versions simultaneously. Teams use the Expand-and-Contract design pattern, breaking schema changes into distinct, non-breaking steps so that both application versions can safely read from and write to the database during the release and any potential rollback window.
Is Blue-Green Deployment suitable for small applications or startups?
It depends on architectural complexity and budget. For small, containerized applications running on shared cloud infrastructure or managed platforms like Kubernetes, Blue-Green deployments are straightforward and cost-effective. However, for resource-constrained teams managing legacy bare-metal infrastructure or monolithic databases with tightly coupled schemas, the operational overhead and compute costs may outweigh the benefits compared to simpler deployment approaches.
Conclusion
Blue-Green Deployment transforms high-risk, stressful release events into predictable, routine operations by combining production-grade pre-release testing with near-instantaneous rollback capabilities. While managing dual infrastructure footprints and executing backward-compatible database migrations require discipline, the payoff—zero-downtime availability, reduced failure blast radius, and high release confidence—makes it an indispensable strategy for resilient engineering organizations. By uniting automated CI/CD pipelines, strict environment parity through Infrastructure as Code, and real-time observability, teams can accelerate deployment frequency while safeguarding user trust and system reliability.